
Part 3 , project 2 : Smart dustbin Monitoring dashboard with IoT technology.
- WatchIT Group

- Jul 11, 2020
- 4 min read
With increase in population we have an increase in the garbage around urban areas. Here we propose a smart dustbin that operates automatically to help solve this issue using IOT and sensor.
a person needs to keep track when it is full so that it can be emptied and does not overflow. Here we propose a smart dustbin that shows the level of the dustbin and notify you accordingly.
the dustbin consists of a level sensing ultrasonic sensor that constantly measures the level of garbage in the bin and automatically detects if it is about to fill up.
This project will be able to monitor the level of garbage in the dustbin and display it via web based dashboard.
Project Architecture
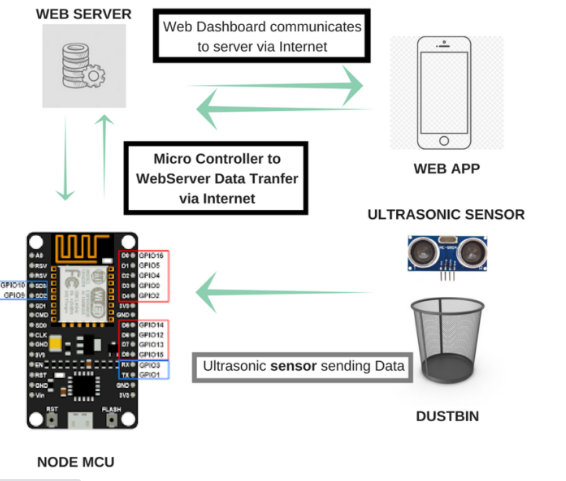
Lets start with the Dustbin Garbage Level Sensor. We are using an Ultrasonic Sensor(HC-SR04). We will fix the ultrasonic sensor on top of the dustbin. The ultrasound sensor will send ultrasound waves which will be reflected by the garbage and the reflected ray will be received by the ultrasound sensor again.
We will apply the principle of sonar and use mathematics to calculate the amount of garbage in the Dustbin. Refer to, Lesson 5 : Ultrasonic sensor for measuring distance with Menya IoT kit
Distance Calculation
Time taken by pulse is actually for to and from travel of ultrasonic signals, while we need only half of this. Therefore time is taken as time/2.
Distance = Speed * Time/2
Speed of sound at sea level = 343 m/s or 34300 cm/s or 29.412 µs
Thus, Distance = 17150 * Time (unit cm)
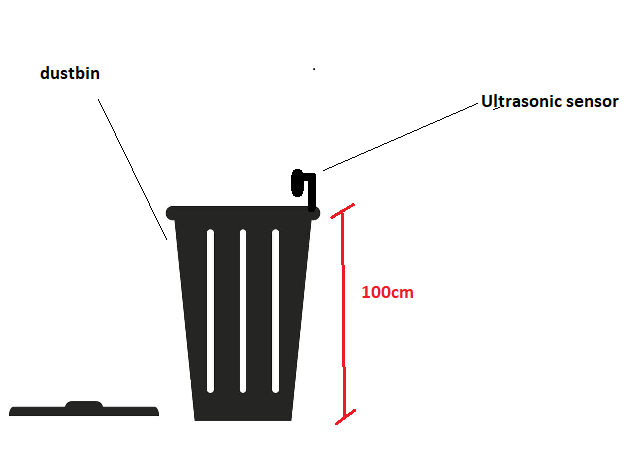
For example, if it takes 100µs (microseconds) for the ultrasonic sound to bounce back, then the distance is ((17150*100)/1000 ) centimeters or about 1.7 centimeters. Now if the depth (or height) of the Dustbin is 100 centimeters then the height of garbage in Dustbin is (100-1.7) =98.3 centimeters .
So the dustbin fill percentage is (98.3/100)*100%=98.3%(approx).
HC-SR04 ultrasonic distance sensor module has four pins:
VCC – 3.3V-5V, input power
TRIG – Trigger Input
ECHO – Echo Output
GND – Ground
VCC ->
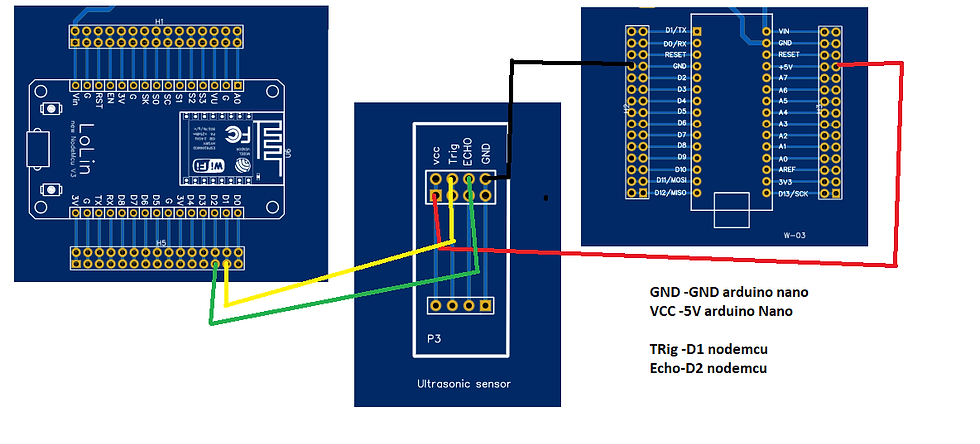
TRIG -> Trigger activates the sensor and connect to GPIO 5 output pin of NodeMCU
ECHO-> Receives the signal, read by GPIO 4 input pin of NodeMCU
GND ->
Here we will connect
GPIO 5( D1) pin —> Ultrasonic sensor TRIG Pin
GPIO 4 (D2) pin —> Ultrasound sensor ECHO Pin
Note that
HC-SR04 needs 5v
HC-SR04P can use 3.3V - 5V
We know that our nodemcu does not have the 5v supply , that is why we are going to use the arduino nano 5v as you can see on circuit diagram.
The NodeMCU will calculate the percentage of garbage in the dust bin using the data provided by the Ultrasonic sensor and post the data to the Internet connected WebServer.
sensor placement
Circuit design
Code
#include <ESP8266WiFi.h>
#include <WiFiClient.h>
#include <ESP8266WebServer.h>

#define  trigPin 5    // Trigger
#define echoPin 4     // Echo
long duration, cm;

const char* ssid = "REPLACE WITH YOUR NETWORK N";// your wifi username
const char* password = "REPLACE WITH PASSWORD"; // your wifi password
int WiFiStrength = 0;
WiFiServer server(80); // port number by default its 80

void setup()
{
  //Serial Port begin
  Serial.begin (9600);
  //Define inputs and outputs
  pinMode(trigPin, OUTPUT);
  pinMode(echoPin, INPUT);

  Serial.print("Connecting to ");
    Serial.println(ssid);
    WiFi.begin(ssid, password);
    // connect to WiFi router
    while (WiFi.status() != WL_CONNECTED)
    {
      delay(500);
      Serial.print(".");
    }
    Serial.println("");
    Serial.println("WiFi connected");
    // Start the server
    server.begin();
    Serial.println("Server started");
    Serial.print("Use this URL to connect: ");
    Serial.print("http://");
    Serial.print(WiFi.localIP());
    Serial.println("/");
  }


void loop()
{
  WiFiStrength = WiFi.RSSI(); // get dBm from the ESP8266
    Serial.print(WiFiStrength);
    Serial.println("dBm");
    Serial.println(" ");
    delay(1000); // slows amount of data sent via serial
    ///Sensor 1 Readings

  int t= 100; //  the dustbin height
  // The sensor is triggered by a HIGH pulse of 10 or more microseconds.
  // Give a short LOW pulse beforehand to ensure a clean HIGH pulse:
  digitalWrite(trigPin, LOW);
  delayMicroseconds(5);
  digitalWrite(trigPin, HIGH);
  delayMicroseconds(10);
  digitalWrite(trigPin, LOW);

  // Read the signal from the sensor: a HIGH pulse whose
  // duration is the time (in microseconds) from the sending
  // of the ping to the reception of its echo off of an object.
  pinMode(echoPin, INPUT);
  duration = pulseIn(echoPin, HIGH);

  // Convert the time into a distance
  cm = (duration/2)*0.0343;


  Serial.print(cm);Serial.print(" cm");
  Serial.println("");
  Serial.println("");

int perc= (((t-cm)*100) / t);
if (perc>100 || perc < 0) // if perc is greater than 100cm and less than 0 (meaning negative) make perc zero.
{
  Serial.println("Sensor is not well installed");
 perc=0;
  }

Serial.print(perc);
Serial.print(" %");

Serial.println("");
Serial.println("");


WiFiClient client = server.available();
    if (!client)
    {
      return;
    }
    // Wait until the client sends some data
    Serial.println("new client");
    // Read the first line of the request
    String request = client.readStringUntil('r');
    Serial.println(request);
    client.flush();
    // Return the response
    client.println("HTTP/1.1 200 OK");
    client.println("Content-Type: text/html");
    client.println(""); //  do not forget this one
    client.println("<!DOCTYPE HTML>");
    client.println("<html>");
    client.println("  <head>");
     client.println(" <meta charset='utf-8'>");
    client.println("<meta http-equiv='X-UA-Compatible' content='IE=edge,chrome=1'>");
    client.println("<meta name='viewport' content='width=device-width, initial-scale=1'>");
     client.println("<style>");
      client.println("body {");
       client.println("background: #FFFFFF;");
     client.println("}");
     client.println("canvas {");
       client.println("display: block;");
       client.println("float: left;");
       client.println("margin: 10px auto;");
     client.println("}");
    client.println(" </style>");
         client.println(" <link href='http://www.jqueryscript.net/css/jquerysctipttop.css' rel='stylesheet' type='text/css'>");
  client.println("<script src='https://ajax.googleapis.com/ajax/libs/jquery/2.1.3/jquery.min.js'></script>");
  client.println("<script src='https://www.jqueryscript.net/demo/jQuery-Plugin-To-Draw-Animated-Gauges-using-Canvas-2D-API/src/jquery.gauge.js'></script>");
    client.println("  <script>");
        client.println("setTimeout(function(){");
       client.println("window.location.reload(1);");
   client.println("}, 58000);");///change this value to alter page auto load speed
         client.println("  </script>");
         client.println("  <script>");
      client.print(" $(document).ready(function (){");
      client.print(" $('#gauge2').gauge(");
    client.print(perc);
     client.print(",{ unit: '%',min:0,max:100, color:'#006400',font: '100px verdana',type: 'halfcircle'});");
     client.println("  });");
    client.println(" </script>");
         client.println("  </head>");
    client.println("  <body>");
     client.println(" <h1 style='margin:20px auto 30px auto; color:#696969;' align='center'>IOT GARBAGE MONITORING DASHBOARD</h1>"); /////Page title
      client.println("<table border='1' align='center'><tr><th>DUSTBIN</th></tr>");
    client.println("<tr>");
       client.println("<td><canvas id='gauge2' width='300' height='200'></canvas></td>");
    client.println("</tr></table>");
    //client.println("</table>");
    client.println("<br><br><table border='1' align='center'><tr><th>DUSTBIN LEVEL INDICATOR </th></tr>");
    client.println("</table>");
    client.print("WiFi Signal Strength: ");
    client.println(WiFiStrength);
    client.println("dBm<br>");
    delay(1);
    Serial.println("Client disonnected");
    Serial.println("");
  }
open the serial Monitor and find the Ip address of the nodemcu , and put it in the browser.
Screenshot of the dashboard
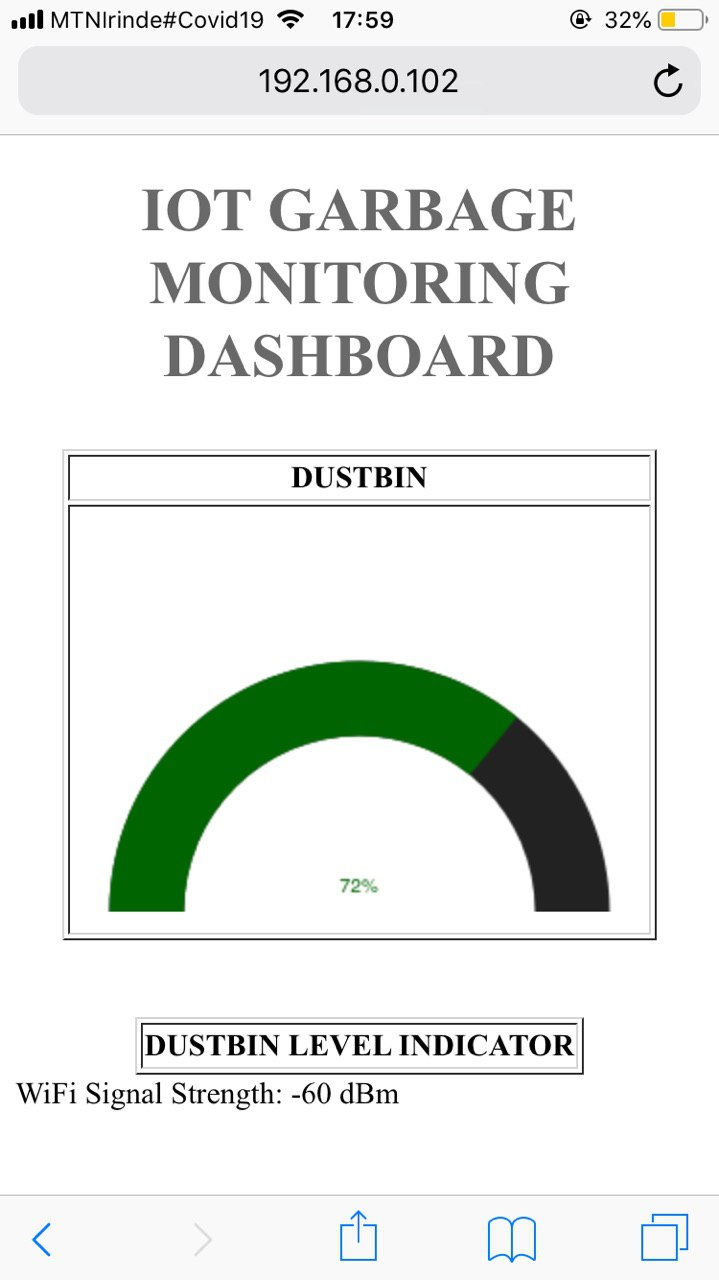
As a bonus this dashboard you can also show the WiFi strength of your network , 60dBm.
This project can be helpful to monitor all the dustbin of a building to help cleaners to followup and be efficient.
A Challenge.
Try to make some changes to this dashboard and improve the dashboard share the screenshots
Also share an idea of a project you can do using the same sensor and nodemcu.
thanks ,
for any question feel free to ask in the comment section.


Hi ! could anyone have an idea how to solve problem of gps neo-6m doesn't show data or print anything when works with max30102 sensor , thank on advance .